Managing sensors
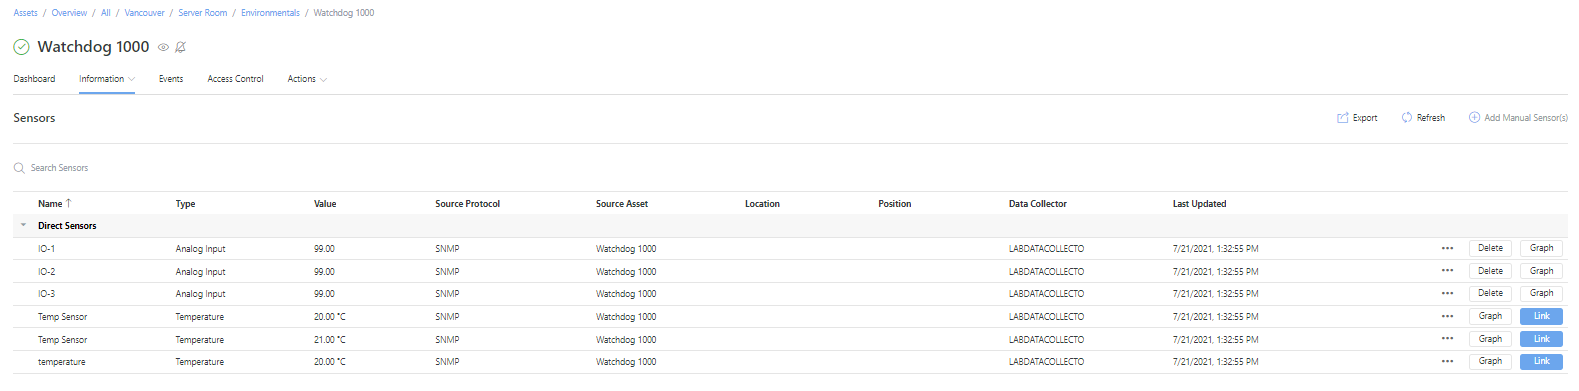
Assuming you have access privileges, you can manage sensors associated with an asset from the Sensors page (Information → Sensors).
What sensors are available depends on the asset itself. Hyperview supports hundreds and thousands of sensor types across its product catalog, such as power sensors, airflow sensors, analog input sensors, temperature sensors, fan speed sensors, humidity sensors, and so on.
Sensor categories
Asset sensors are listed under one of the following categories in the Sensors grid:
Direct sensors are sensors that are directly associated with a device. They are created by the manufacturer and get generated in Hyperview upon device discovery. For example: the CPU Load sensor for servers.
Computed sensors are auto-generated by Hyperview based on relevant data. For instance: the Total Output Load sensor for a power-providing device, such as a rack PDU.
Linked sensors are sensors that are read from one asset, but linked to another. For example: reading a location’s temperature using a linked environmental monitor’s temperature sensor.
Manual sensors are manually configured and maintained by users (Power Users and above). They are not discovered or generated by Hyperview; you need to add them and input values. For example: manual setpoint sensors.
Linking sensors
You can link a sensor from a source asset to one or more target assets. A target asset is generally a rack or location that hosts the source asset, or a device with a shared power connection.
The following sensor types are linkable:
Output total power sensors
Certain humidity sensors (Humidity, Supply Humidity, and Return Humidity)
Certain temperature sensors (Ambient Temperature, Temperature, Supply Temperature, and Return Temperature)
Rack door sensors (automatically linked; only relevant to Rack Security licensees)
To link a sensor:
Open the Sensors page for the asset with the linkable sensor.
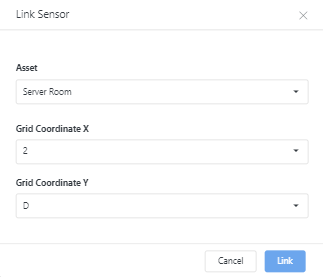
Click on the sensor’s Link button.
Select the target asset from the Asset dropdown. Only relevant assets can be selected.
Note
You must add a layout grid to a location before you can link it to a temperature or humidity sensor.
Click Link to link the sensor to the selected asset.
If you are linking a temperature or humidity sensor to a location, you must first specify Grid Coordinate X and Grid Coordinate Y values.
If you are linking a temperature or humidity sensor to a rack, you must first specify the Rack Location (Front or Rear) and the rack U (number).
Note
You cannot link a sensor type that is already linked to the target asset. For temperature and humidity sensors, you can only specify unoccupied positions (Grid Coordinate X and Grid Coordinate Y values, or Front or Rear rack U).
A success message will appear once the link is created. Subsequently:
The “Link” button for the sensor on the source asset’s Sensors page will change to “Unlink”.
The target asset’s Sensors grid will list the sensor under Linked Sensors.
Using manual sensors
You may want to add manual sensors to assets that cannot be discovered, or because you want to update sensor values for the asset or asset components manually.
What sensor types can be added manually?
As of Hyperview 2.5, you can add the following numeric sensor types:
Sensor types for power-consuming devices:
Power
Current
Sensor types for power-providing devices:
Output Total Power
Output Total Current
Additionally, you can add manual sensors to asset components. The following numeric sensor types are supported (PDU/RPP, rack PDU, and busway assets only):
Power sensor types:
Breaker Power (for PDU breakers)
Outlet Power (for rack PDU outlets)
Tap Off Power (for busway tap-offs)
Current sensor types:
Breaker Current (for PDU breakers)
Outlet Current (for rack PDU outlets)
Tap Off Current (for busway tap-offs)
Note
You can only add manual sensors to an asset if its Sensor Monitoring Profile (Information → Sensor Monitoring) is set to “Manual”. Updating an asset’s Sensor Monitoring Profile will delete its existing sensors.
Adding a manual sensor to an asset
You can add manual sensors to any asset type.
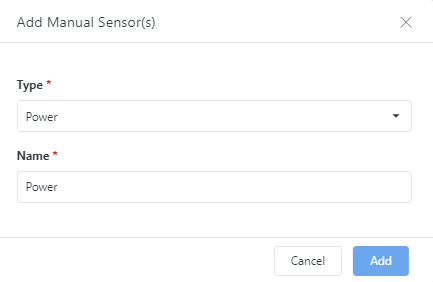
Click the “Add Manual Sensor(s)” button on the asset’s Sensors page.
Select a Type and update the Name value (which defaults to Type name) as needed.
Click Add.
A success message will appear, and the sensor will be listed in the grid.
Adding a manual sensor to an asset component
You can only add manual sensors to PDU/RPP, rack PDU, and busway asset components.
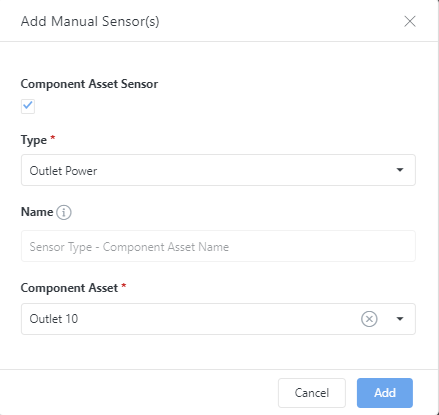
Click the “Add Manual Sensor(s)” button on the asset’s Sensors page.
Select the “Component Asset Sensor” checkbox.
Select a Type and the target Component Asset (note: the Name field is read-only and auto-populated).
Click Add.
A success message will appear, and the sensor will be listed in the grid.
Deleting sensors
Deleting a sensor removes it from Hyperview: it will no longer appear in search results, the asset’s Sensors page, or Sensors pages of other linked assets. Raw sensor data and sensor daily summaries for the sensor will also be deleted, and Hyperview will automatically recalculate relevant computed sensors.
Note
You can re-generate the sensor (as a new sensor) by rediscovering the asset, or by adding or re-adding it manually.
To delete a sensor:
Click the Delete button for the sensor in the Sensors grid. Note that the Delete button might be hidden by default; click the ellipsis (three dots) to reveal it.
Click Delete to confirm.
A success message will appear.
Graphing sensors
You can generate a sensor graph by clicking the corresponding Graph button in the Sensors grid.
Graphs can be generated for both numeric and string values over a UTC time interval. You can select a different interval (or specify a custom one) using the dropdown list.
Sensor data points appear in the graph when you hover on it. The number of data points will depend on your polling interval, device reachability, and the UTC time interval for the graph (using a time interval of 7 days or more will show daily summary data points instead of raw sensor data).
Note
Sensor data retention thresholds for your Hyperview instance are listed on the License page (Settings → License). Daily sensor data summaries can be stored for up to ten years, depending on your license.
Exporting sensor graphs and data
The Sensors page lets you export sensor data directly from the grid, and export a sensor graph directly from the graph modal.
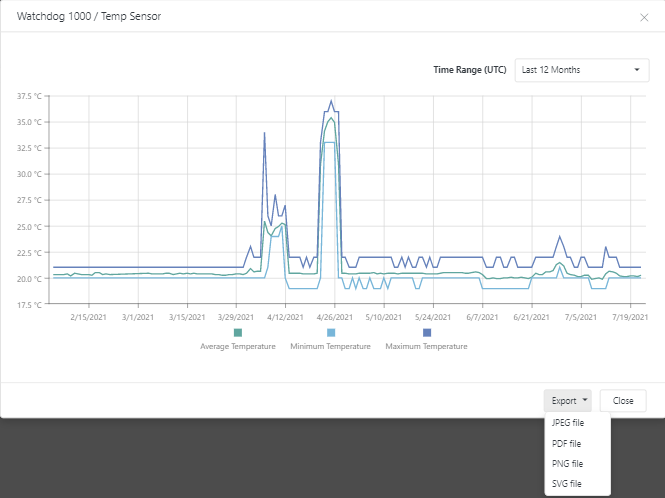
Exporting a sensor graph
Sensor graphs can be exported in JPEG, PDF, PNG, and SVG formats.
Open the graph modal for the sensor by clicking the Graph button.
Update the Time Interval (UTC) value as needed.
Click the Export dropdown and select a file format.
The file will download to your browser’s default download location.
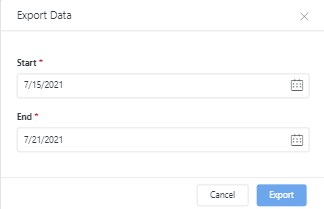
Exporting sensor data
You can export sensor data for a specific timeframe (up to seven consecutive days) as a CSV file.
Click the Export Data button in the sensor in the Sensors grid. Note that the Export Data button might be hidden by default; click the ellipsis (three dots) to reveal it.
Specify the Start and End dates.
Click Export.
The file will download to your browser’s default download location.
Tip
You can also export the entire grid. See Extracting Data for instructions.